2  Data test

2.1 Tourism Data

2.1.1 Technical Description

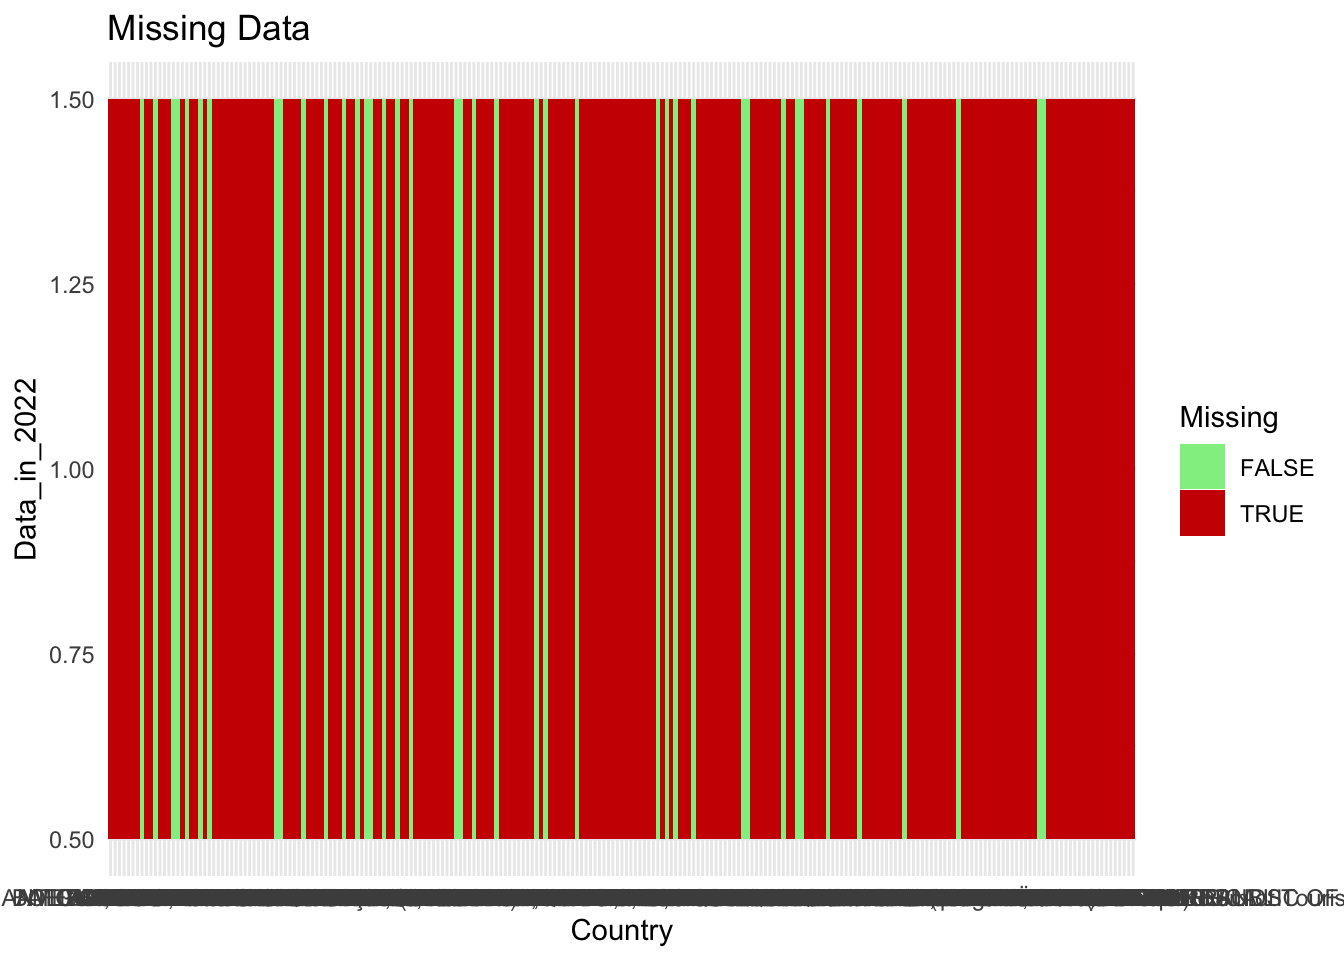
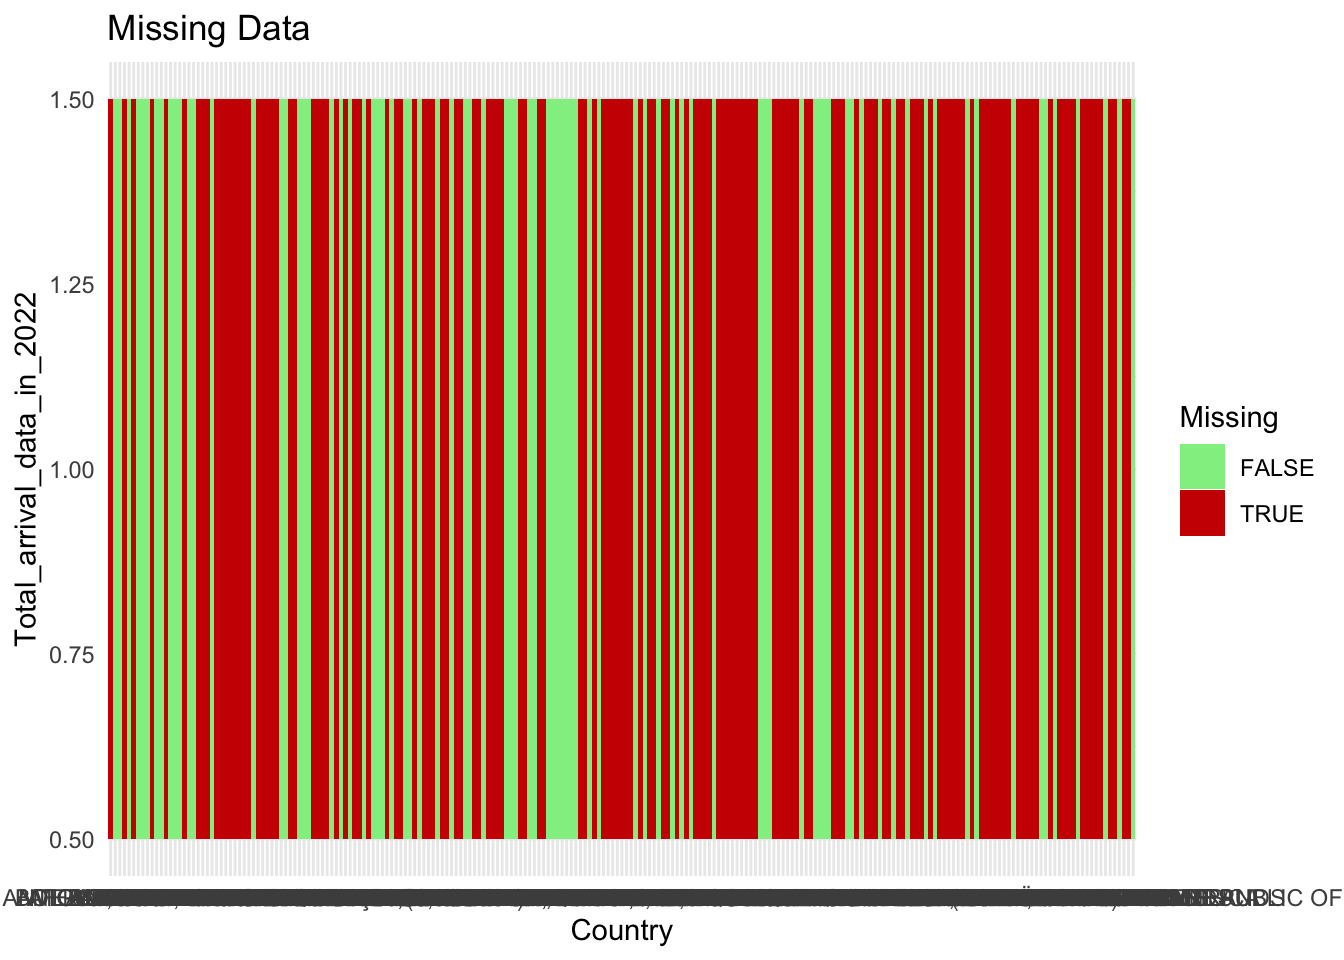
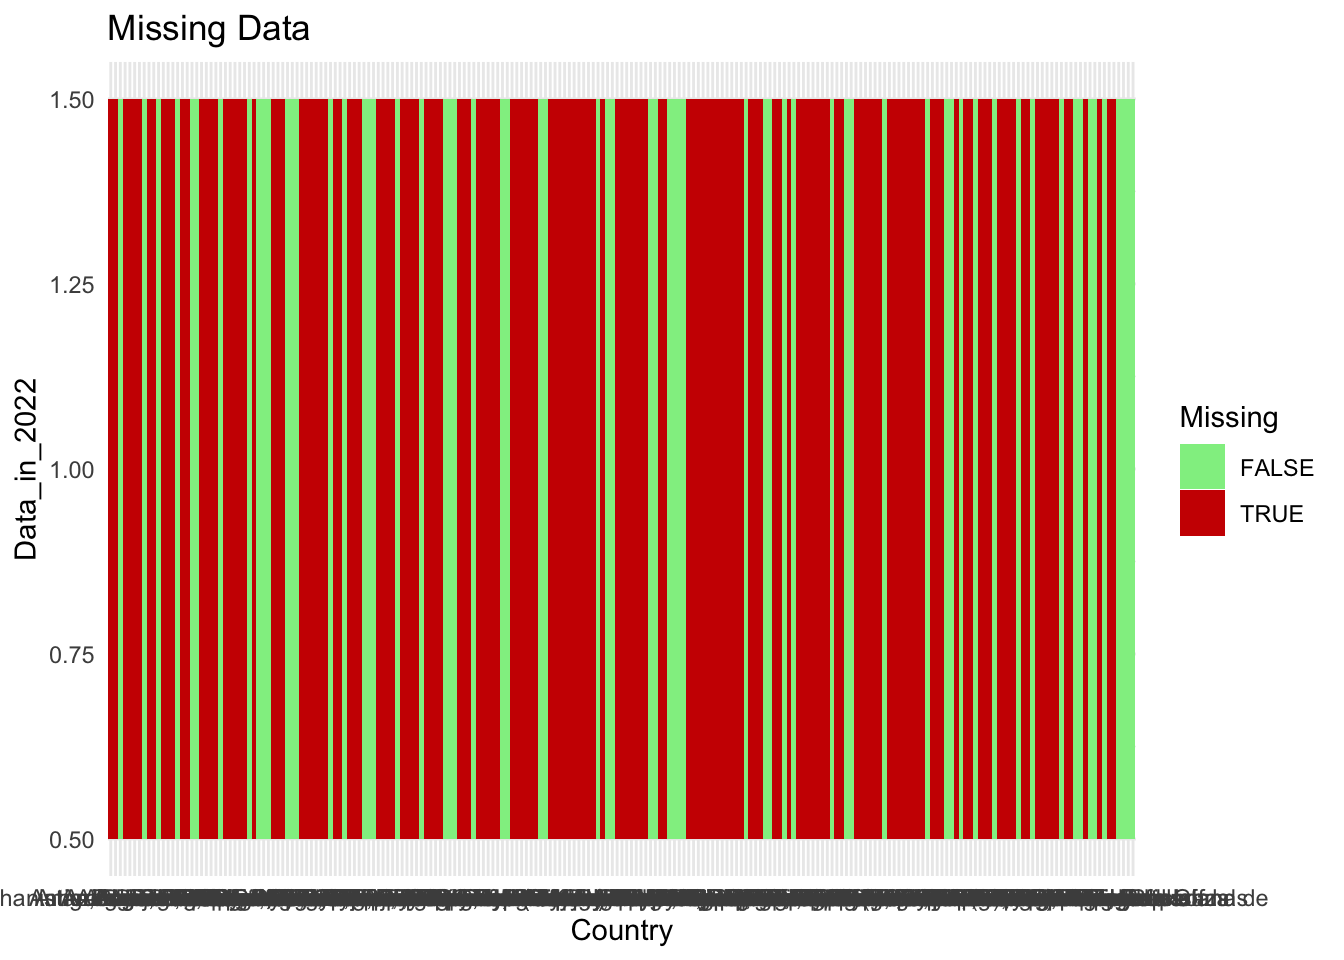
For our project, we will use data on global tourism and related variables and indicators to study the effect tourism has on countries around the world. The main tourism-specific data that we will be using comes from the United Nations World Tourism Organization (UNWTO). We will draw data from their “Tourism Statistics Database”, from which we will use five tables containing tourism indicators for each country. The tables have data for Inbound Tourism, Domestic Tourism, Outbound Tourism, Tourism Industries, and Employment. Inbound, Domestic, and Outbound Tourism tables have data on arrivals, accommodation, expenditure, and departures. We will focus on inbound arrivals and employment. The data provides indicators by country, with values (in thousands) for each indicator from 1995-2022. Countries are listed in the same column as the indicators, with the same indicators for each country following in the rows after the country name. Therefore, to make this data useful for graphing, we will need to do quite a bit of engineering to organize indicators. The data is collected yearly from countries by the UNWTO, with the most recent data update taking place October 2023. However, our data is yearly and thus only goes until 2022, since the full data for 2023 is not yet available. Further, the data requires that each individual country accurately and routinely tracks tourism data and then reports it to the United Nations, and thus there is a large amount of missing data for many countries, especially in earlier years. In fact, the UN did not outline their International Recommendations for Tourism Statistics (IRTS 2008) until 2008, and the World Tourism Organization only became an agency of the UN in 2004, so data was not as regulated before these years.

To study the effects that tourism has on the economy, climate, and happiness, we will use supplemental data. For economic factors, we will study employment from the UNWTO data, and will also use data from the International Monetary Fund (IMF) to analyze the relationship between tourism and GDP. The data is a simple table where rows are countries, columns are the years from 1980 to 2028, with data from 2023 to 2028 being projected values.The values in the table represent actual GDP values for each country and year. The data comes from the IMF’s World Economic Outlook report, which is updated yearly. The data mapper from which we are pulling data only includes some indicators from the entire report. Data is collected as accurately as possible by IMF employees, and historical data is updated as more information becomes available. Though the employees of IMF gather data as meticulously as possible, of course there are still gaps. Similarly to tourism data, much of the data is missing in earlier years. Our downloaded data was updated October 2023.

Our climate data also comes from the International Monetary Fund, from their Climate Change Dashboard, which offers global data on many climate change indicators. We will be studying Climate-related Disasters data. This data is organized similarly to the GDP data, with rows being for countries and columns for years 1980-2022. The values in the table indicate the number of climate-related disasters that occurred in each country for each year. Each country has multiple rows, since for each there is a row for drought, temperature, flood, wildfire, storm, landslide, and total. The data was last updated in April 2023, but data is updated when there is availability of new indicators or methodology, which does not have a set schedule. Again, similar to GDP, data is collected and released by IMF employees to the best of their ability.

Finally, we will use happiness data from the World Happiness Report, which gathers data from the Gallup World Poll surveys from 2020 to 2022. Unfortunately, the average sample size from the poll is 1,000 people per country, and thus the data is far from conclusive. However, the data offers multiple “happiness indicators” from the poll for any participating countries. Some examples are Social support data, a Healthy Life score, a value for “Freedom to make life choices”, and more. Data is quantitative, using an average score from the Gallup poll. The report has been released most years since 2012, but we will focus on the most recent report, with data from the 2023 Gallup poll.

For all data, we will download excel or csv files and read them as data frames. The indicator data (economy, climate, happiness) will not need much engineering beyond missing values. UNWTO data will need to be pivoted. Then, data will be joined by country name to conduct our analysis and create graphs.

2.1.2 Research Plan

Based on our multi-faceted approach to understanding tourism, we plan to use the following data sources to answer our research questions:

Tourism by Country:

  • UNWTO Statistics: https://www.unwto.org/tourism-statistics/key-tourism-statistics

    • This dataset contains information on inbound, domestic and outbound tourism for countries around the world

    • For inbound tourism, UNWTO provides data on travel purpose, mode of transportation, traveler accommodations, and tourism expenditure

    • The dataset also contains expenditure information for domestic and outbound travels

    • We will use this data to identify trends in inbound travel across countries and larger regions. Visualizing the inbound expenditures data, especially, enables us to understand how much tourists contribute to local economies at a high level

Tourism and the Economy:

Climate Conditions:

  • Our World in Data, Tourism Charts: https://ourworldindata.org/tourism#all-charts

    • This site contains data pertaining to per capita CO₂ emissions from commercial aviation, adjusted for tourism, in 2018. While it is not the most current data, we can use this data to understand how travel contributes to CO₂ emissions
  • IMF Climate-Related Disasters Frequency: https://climatedata.imf.org/datasets/b13b69ee0dde43a99c811f592af4e821/explore

    • The IMF aggregated the number of climate-related disasters for each country from 1980 to 2022. Paired with information on tourism GDP and tourist influx, we can understand whether changes in tourism coincide with any climate-related events.
  • Berkeley Earth Global Temperature Data: https://berkeleyearth.org/data/

    • The Berkeley Earth database contains average temperatures (highs, lows and true average) by global regions and select countries. We can use this data to get an idea of how temperatures have have fluctuated across regions and whether the fluctuations coincide with climate-related events or changes in tourism.
  • Comparative Climate Change Data in the US: https://www.ncei.noaa.gov/products/land-based-station/comparative-climatic-data

    • While the data in this site is limited to the United States, we can explore data related to temperature and precipitation to understand climate trends in the US.

    • We can also leverage this data to determine if there are coinciding trends between climate and US tourism

  • World Happiness Report: https://worldhappiness.report/data/

    • We can explore the various happiness metrics in relation to the GDP per capita provided in the data set and extrapolate any trends to trends in tourism as well. The happiness metrics could give us further insight into which aspects of the country’s infrastructure (i.e. political, social) are most strongly tied to GDP per capita, GDP fluctuations over the year and tourism levels, which would help us answer whether happiness and tourism can be associated with each other.

    • This data could lend itself to PCA, as we can determine how strength of association between happiness factors and can determine where the countries lie in relation to these factors.

2.1.3 Missing value analysis

2.1.3.1 UNWTO Tourism Data

Code
#Read data from excel
#install.packages("readxl")

suppressMessages(library(readxl))
suppressMessages(library(tidyr))
suppressMessages(library(dplyr))

suppressMessages(sheet_names <- excel_sheets("data_raw/unwto-all-data-download_102023.xlsx"))

#create a data frame for each sheet and store them in all_dfs
suppressMessages(all_dfs <- lapply(sheet_names, function(sheet) {
  read_excel("data_raw/unwto-all-data-download_102023.xlsx", sheet = sheet)
}))
Code
#access the desired dataframe from all_dfs
inbound_arrivals <- as.data.frame(all_dfs[2])

#Cleaning up the data set to remove unnecessary rows and columns, and rename/change type of columns
cols_to_del = c(-1,-2,-3)

inbound_arrivals <- inbound_arrivals[,cols_to_del]

col_names <- inbound_arrivals[2, ]

inbound_arrivals <- inbound_arrivals[-2, ]

colnames(inbound_arrivals) <- col_names

names(inbound_arrivals)[names(inbound_arrivals)=="Basic data and indicators"] <- "Country"

names(inbound_arrivals)[2:5] <- c("2", "3", "4", "5")

inbound_arrivals <- inbound_arrivals[-1,-37]

inbound_arrivals <- inbound_arrivals %>%
  mutate_all(~ ifelse(. == "..", NA, .))

columns_indices_to_convert <- 10:36

inbound_arrivals <- inbound_arrivals %>%
  mutate_at(columns_indices_to_convert, as.numeric)
Code
# Replace empty rows for country with the last non-empty value until a new value appears
inbound_arrivals <- inbound_arrivals %>%
  fill("Country")

#Merging arrival types into one column
columns_to_merge <- c("2","3","4","5") 

inbound_arrivals <- inbound_arrivals %>%
  mutate(Merged_Column = coalesce(!!!syms(columns_to_merge)))

column_names <- names(inbound_arrivals)

#moving the merged column to the front of the dataframe
last_column <- column_names[length(column_names)]

inbound_arrivals <- inbound_arrivals[, !names(inbound_arrivals) %in% columns_to_merge]

column_to_move <- "Merged_Column"
new_position <- 2

inbound_arrivals <- inbound_arrivals %>%
  select(-{{column_to_move}}) %>%
  mutate({{column_to_move}} := inbound_arrivals[[column_to_move]]) %>%
  select({{column_to_move}}, everything())
Code
library(ggplot2)

#manipulate data to show missing values in a given year
inbound_arrivals$Missing <- is.na(inbound_arrivals$`2022`)
inbound_arrivals$Data_in_2022 <- 1

ggplot(data = inbound_arrivals, aes(x = Country, y = Data_in_2022, fill=Missing)) +
  geom_tile() +
  scale_fill_manual(values = c("TRUE" = "red3", "FALSE" = "lightgreen")) +
  theme_minimal() +
  labs(title = "Missing Data") 

The data from UNWTO is quite sparse, as we can see in the plot above. This graph shows us how much missing data there is for each country for 2022 inbound arrivals data. To deal with this missing data, we may choose to study only those countries with at least one value in a given year. There is no benefit to including countries who do not report their tourism data in our study.

Code
#subset for total arrivals rather than all arrival types
total_inbound <- subset(inbound_arrivals, inbound_arrivals$Merged_Column =="Total arrivals")
total_inbound$Missing <- is.na(total_inbound$`2022`)
total_inbound$Total_arrival_data_in_2022 <- 1

#manipulate data to show missing values in a given year
ggplot(data = total_inbound, aes(x = Country, y = Total_arrival_data_in_2022, fill=Missing)) +
  geom_tile() +
  scale_fill_manual(values = c("TRUE" = "red3", "FALSE" = "lightgreen")) +
  theme_minimal() +
  labs(title = "Missing Data")

When we just look at total arrivals for inbound arrival data in 2022, we see a lot more values across countries. The data is still quite sparse, so we will still want to study countries only if they have at least one value in the year we are studying, but this suggests that “Total arrivals” could be a better case study than looking at all different types of inbound arrivals.

2.1.3.3 GDP and Happiness Data

Code
GDP_df <- read_excel("data_raw/imf-dm-export-20231214.xls") 

GDP_df<-as.data.frame(GDP_df[-1,])

names(GDP_df)[names(GDP_df)=="Real GDP growth (Annual percent change)"] <- "Country"

GDP_df <- GDP_df %>%
  mutate_all(~ ifelse(. == "no data", NA, .))
Code
happiness_df <- read_excel("data_raw/DataForFigure2.1WHR2023.xls")

happiness_df<-as.data.frame(happiness_df)

Our GDP and Happiness data are very well populated. GDP is particularly well documented in later years. The happiness study only draws from countries who respond to the survey, and values are averages across those countries, so there is no missing data.